createColorRamp() is a wrapper for GDALCreateColorRamp() in the GDAL
API. It automatically creates a color ramp from one color entry to another.
Output is an integer matrix in color table format for use with
GDALRaster$setColorTable().
Arguments
- start_index
Integer start index (raster value).
- start_color
Integer vector of length three or four. A color entry value to start the ramp (e.g., RGB values).
- end_index
Integer end index (raster value).
- end_color
Integer vector of length three or four. A color entry value to end the ramp (e.g., RGB values).
- palette_interp
One of "Gray", "RGB" (the default), "CMYK" or "HLS" describing interpretation of
start_colorandend_colorvalues (see GDAL Color Table).
Value
Integer matrix with five columns containing the color ramp from
start_index to end_index, with raster index values in column 1 and
color entries in columns 2:5).
Note
createColorRamp() could be called several times, using rbind() to
combine multiple ramps into the same color table. Possible duplicate rows
in the resulting table are not a problem when used in
GDALRaster$setColorTable() (i.e., when end_color of one ramp is the
same as start_color of the next ramp).
Examples
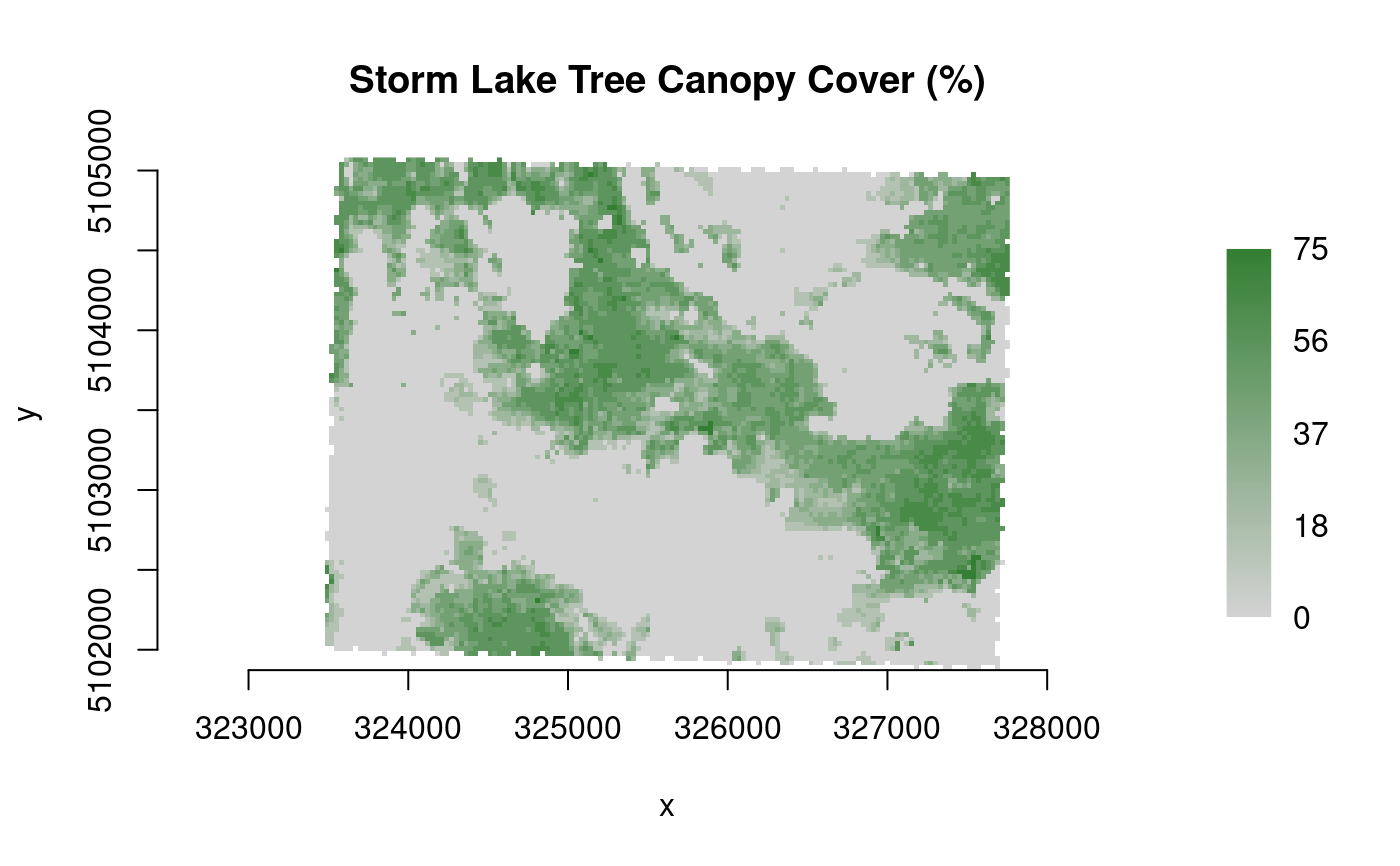
# create a color ramp for tree canopy cover percent
# band 5 of an LCP file contains canopy cover
lcp_file <- system.file("extdata/storm_lake.lcp", package="gdalraster")
ds <- new(GDALRaster, lcp_file)
ds$getDescription(band=5)
#> [1] "Canopy cover"
ds$getMetadata(band=5, domain="")
#> [1] "CANOPY_COV_FILE=/netapp/sharedwebfs1/shared/landfire/public/temp_q8dTbIJ4w6Qi36Omkzk0/LCP_LF2022_FBFM40_220_CONUS/temp/merged_modified.tif"
#> [2] "CANOPY_COV_MAX=75"
#> [3] "CANOPY_COV_MIN=-9999"
#> [4] "CANOPY_COV_NUM_CLASSES=8"
#> [5] "CANOPY_COV_UNIT=1"
#> [6] "CANOPY_COV_UNIT_NAME=Percent"
ds$close()

# create a GTiff file with Byte data type for the canopy cover band
# recode nodata -9999 to 255
tcc_file <- calc(expr = "ifelse(CANCOV == -9999, 255, CANCOV)",
                 rasterfiles = lcp_file,
                 bands = 5,
                 var.names = "CANCOV",
                 fmt = "GTiff",
                 dtName = "Byte",
                 nodata_value = 255,
                 setRasterNodataValue = TRUE)
#> calculating from 1 input layer(s)...
#> ================================================================================
#> output written to: /tmp/RtmpO4j4Ij/rastcalc1f582c34bf1e.tif

ds_tcc <- new(GDALRaster, tcc_file, read_only=FALSE)

# create a color ramp from 0 to 100 and set as the color table
colors <- createColorRamp(start_index = 0,
                          start_color = c(211, 211, 211),
                          end_index = 100,
                          end_color = c(0, 100, 0))

print(colors)
#>        value red green blue alpha
#>   [1,]     0 211   211  211   255
#>   [2,]     1 208   209  208   255
#>   [3,]     2 206   208  206   255
#>   [4,]     3 204   207  204   255
#>   [5,]     4 202   206  202   255
#>   [6,]     5 200   205  200   255
#>   [7,]     6 198   204  198   255
#>   [8,]     7 196   203  196   255
#>   [9,]     8 194   202  194   255
#>  [10,]     9 192   201  192   255
#>  [11,]    10 189   199  189   255
#>  [12,]    11 187   198  187   255
#>  [13,]    12 185   197  185   255
#>  [14,]    13 183   196  183   255
#>  [15,]    14 181   195  181   255
#>  [16,]    15 179   194  179   255
#>  [17,]    16 177   193  177   255
#>  [18,]    17 175   192  175   255
#>  [19,]    18 173   191  173   255
#>  [20,]    19 170   189  170   255
#>  [21,]    20 168   188  168   255
#>  [22,]    21 166   187  166   255
#>  [23,]    22 164   186  164   255
#>  [24,]    23 162   185  162   255
#>  [25,]    24 160   184  160   255
#>  [26,]    25 158   183  158   255
#>  [27,]    26 156   182  156   255
#>  [28,]    27 154   181  154   255
#>  [29,]    28 151   179  151   255
#>  [30,]    29 149   178  149   255
#>  [31,]    30 147   177  147   255
#>  [32,]    31 145   176  145   255
#>  [33,]    32 143   175  143   255
#>  [34,]    33 141   174  141   255
#>  [35,]    34 139   173  139   255
#>  [36,]    35 137   172  137   255
#>  [37,]    36 135   171  135   255
#>  [38,]    37 132   169  132   255
#>  [39,]    38 130   168  130   255
#>  [40,]    39 128   167  128   255
#>  [41,]    40 126   166  126   255
#>  [42,]    41 124   165  124   255
#>  [43,]    42 122   164  122   255
#>  [44,]    43 120   163  120   255
#>  [45,]    44 118   162  118   255
#>  [46,]    45 116   161  116   255
#>  [47,]    46 113   159  113   255
#>  [48,]    47 111   158  111   255
#>  [49,]    48 109   157  109   255
#>  [50,]    49 107   156  107   255
#>  [51,]    50 105   155  105   255
#>  [52,]    51 103   154  103   255
#>  [53,]    52 101   153  101   255
#>  [54,]    53  99   152   99   255
#>  [55,]    54  97   151   97   255
#>  [56,]    55  94   149   94   255
#>  [57,]    56  92   148   92   255
#>  [58,]    57  90   147   90   255
#>  [59,]    58  88   146   88   255
#>  [60,]    59  86   145   86   255
#>  [61,]    60  84   144   84   255
#>  [62,]    61  82   143   82   255
#>  [63,]    62  80   142   80   255
#>  [64,]    63  78   141   78   255
#>  [65,]    64  75   139   75   255
#>  [66,]    65  73   138   73   255
#>  [67,]    66  71   137   71   255
#>  [68,]    67  69   136   69   255
#>  [69,]    68  67   135   67   255
#>  [70,]    69  65   134   65   255
#>  [71,]    70  63   133   63   255
#>  [72,]    71  61   132   61   255
#>  [73,]    72  59   131   59   255
#>  [74,]    73  56   129   56   255
#>  [75,]    74  54   128   54   255
#>  [76,]    75  52   127   52   255
#>  [77,]    76  50   126   50   255
#>  [78,]    77  48   125   48   255
#>  [79,]    78  46   124   46   255
#>  [80,]    79  44   123   44   255
#>  [81,]    80  42   122   42   255
#>  [82,]    81  40   121   40   255
#>  [83,]    82  37   119   37   255
#>  [84,]    83  35   118   35   255
#>  [85,]    84  33   117   33   255
#>  [86,]    85  31   116   31   255
#>  [87,]    86  29   115   29   255
#>  [88,]    87  27   114   27   255
#>  [89,]    88  25   113   25   255
#>  [90,]    89  23   112   23   255
#>  [91,]    90  21   111   21   255
#>  [92,]    91  18   109   18   255
#>  [93,]    92  16   108   16   255
#>  [94,]    93  14   107   14   255
#>  [95,]    94  12   106   12   255
#>  [96,]    95  10   105   10   255
#>  [97,]    96   8   104    8   255
#>  [98,]    97   6   103    6   255
#>  [99,]    98   4   102    4   255
#> [100,]    99   2   101    2   255
#> [101,]   100   0   100    0   255
ds_tcc$setColorTable(band=1, col_tbl=colors, palette_interp = "RGB")
#> [1] TRUE
ds_tcc$setRasterColorInterp(band = 1, col_interp = "Palette")

# close and re-open the dataset in read_only mode
ds_tcc$open(read_only=TRUE)

plot_raster(ds_tcc, interpolate = FALSE, legend = TRUE,
            main = "Storm Lake Tree Canopy Cover (%)")

ds_tcc$close()